IoT-based Pump System Analysis
Internet of Things (IoT) system promises ease of information access as well as a way to reduce costs has. More tech managers are looking into it and preparing to invest on it, be it for their new asset or a legacy system. However, since not every legacy system has the capability to connect to the internet in the first place, upgrading the whole system might cost more than a company could afford. One of the solutions is to create a single gateway device that can connect this legacy system to the internet via established connection protocol.
This project is made during my internship tenure at Siemens from May to August 2019. Along with my co-worker Nabila Zahra, we were assigned to create an open source IoT system for process analytics for the company portfolio. We made a separate application, though, mine was using Dash web analytics framework while she used Django and JSON-based message passing.
The pump system
Let’s take a look at the pump system. Here, I installed the IoT system on a simulated pump system instead of a real system because our scope of work is mainly on the higher layer of the IoT.
 pump system
This simple pump system is designed to move water from the lower reservoir to the upper reservoir. There are sensors installed on the system, from which we can collect the system condition. Two flow meters and two pressure meters are installed just before inlet and after outlet of the pump, which measure suction and discharge condition respectively. There is also a power meter that measures power consumption of the pump.
Architecture
 iot system architecture
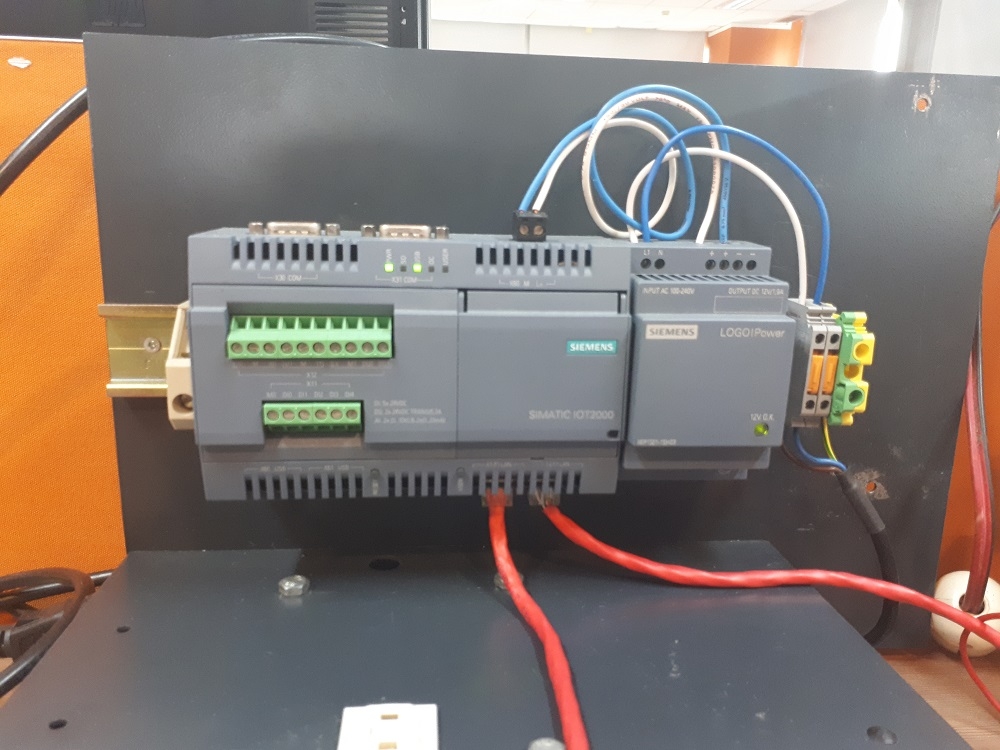
I used Siemens SIMATIC IOT2000 as the main gateway to that of the legacy devices. In order to connect the gateway to the internet, we use a laptop as the network bridge. Inside the gateway, a script collects every data that is sent by the connected devices. The data are published to a cloud MQTT broker which then will subscribed by a web-based dashboard application.
iot system architecture
I used Siemens SIMATIC IOT2000 as the main gateway to that of the legacy devices. In order to connect the gateway to the internet, we use a laptop as the network bridge. Inside the gateway, a script collects every data that is sent by the connected devices. The data are published to a cloud MQTT broker which then will subscribed by a web-based dashboard application.
Web-based dashboard
 web application architecture
To create the dashboard, I used Dash analytics framework. Dash is based on Flask, a lightweight web framework for Python, and Plotly graphs for visualization. Since my work is considered lightweight, I don’t use a separate database server. Instead, I use SQLite to store the subscribed data from the MQTT broker, as shown on the figure above. These data is then visualized with Plotly graphs as a web-based dashboard.
web application architecture
To create the dashboard, I used Dash analytics framework. Dash is based on Flask, a lightweight web framework for Python, and Plotly graphs for visualization. Since my work is considered lightweight, I don’t use a separate database server. Instead, I use SQLite to store the subscribed data from the MQTT broker, as shown on the figure above. These data is then visualized with Plotly graphs as a web-based dashboard.
Preview

- Live monitoring
This section shows the raw measurement value of the sensor. Note that pressure values are displayed in terms of head (m) instead of SI unit Pascal (Pa). - Energy Performance Indicators (EPIs)
This section shows energy-related metrics for the pump system. - Status Using sets of predefined criteria, the dashboard can display if there is a problem at the running pump system.
- Consumption, Cost, and CO2 Emissions
This section shows energy-related metrics for the pump system. - Overall Energy Efficiency Graph
In here we could tell if the pump performance has degraded over time. - Energy Breakdown
The pie chart shows how the energy is used by the whole system, how much is the useful work, how much work loss to friction, etc. This chart could tell if there is a problem in a specific part of the system. - Performance Classification
Overall performance grade of the system.
Github
Visit the repository here to download